Loading tool…
Loading interactive tool…

Engineering reference

Theory, method, validation, and sources

The interactive workspace is paired with its published engineering context: core equations, assumptions, design boundaries, and source references. Worked examples, validation cases, and editorial review dates are displayed only where that supporting evidence has been published for the tool.

Calculations run locallyContent reviewed August 10, 2026Calculation & source methodology

How this tool works

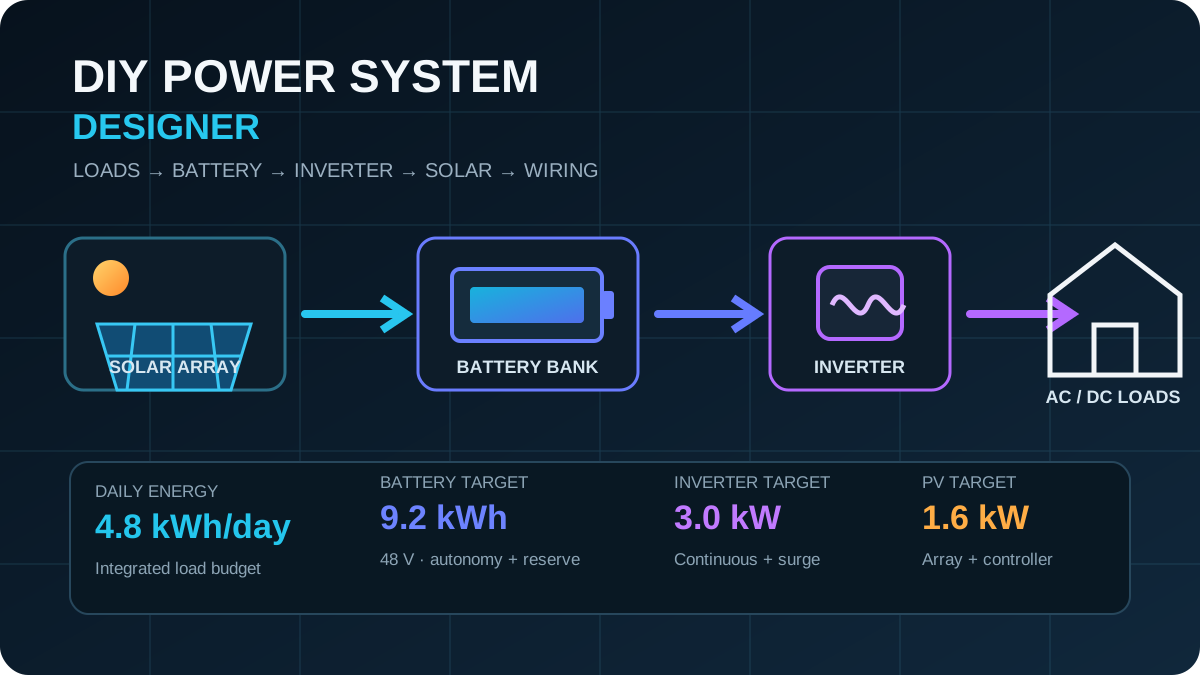
The DIY Power System Designer is an integrated planning workbench for small off-grid, backup, mobile, workshop, laboratory, and experimental electrical systems. One load table feeds the battery, inverter, solar, and charge-controller calculations so assumptions stay synchronized.

Phase 4 uses transparent first-principles energy and power budgeting rather than a black-box product selector. It distinguishes daily energy from instantaneous power, keeps AC surge sizing separate from battery autonomy, and now adds hourly dispatch so timing-related deficits become visible.

The hourly simulator repeats each load schedule across the selected number of days, models a normalized PV-production window, enforces inverter/controller/battery-current limits, and tracks state of charge, unserved energy, and curtailment. A separate PV String + MPPT module checks temperature-adjusted Voc/Vmp and controller input/output limits.

Measured Profile Import can replace the synthetic load and/or solar curves with timestamped CSV data. Sub-hour power samples are held to the next timestamp and integrated into hourly bins so energy is preserved; measured irradiance can also be converted into modeled PV power from the installed array rating and an explicit derate factor.

Phase 4 now also includes a battery-realism screen for retained capacity, temperature capacity factor, Peukert/rate effects, and charge/discharge C-rate limits, plus a hybrid-source dispatcher for optional grid/shore support and SOC-controlled generator operation with a first-pass fuel estimate.

Long-Term / Seasonal Simulation extends that same hourly hybrid dispatcher to 7, 30, or 365 days. Jan-Dec load and PV multipliers shape synthetic profiles, while monthly summaries expose energy balance, minimum SOC, grid/generator dependence, generator fuel/run time, battery throughput, curtailed PV, loss-of-load hours, and service percentage.

Reliability + Lifecycle re-runs a standardized 365-day seasonal dispatch for every project year while applying explicit battery cycle/calendar fade, PV degradation, optional load growth, and generator run-hour maintenance/replacement thresholds. The result is a scenario projection of annual service, renewable contribution, grid/fuel use, replacements, maintenance, and cumulative entered cost rather than a lifetime guarantee.

The DC Distribution + Protection module maps the synchronized inverter, PV-controller, DC-load, and charger currents onto a simple battery/DC-bus one-line architecture. It screens manufacturer busbar/disconnect current ratings, branch voltage drop, configurable current density, and nominal fuse/breaker planning targets while keeping actual conductor ampacity, fault current, interrupt rating, and time-current coordination outside the model.

The Architecture Comparison module holds the same energy, inverter, PV, module, BMS-current, and conductor-path assumptions constant while comparing 12 V, 24 V, 48 V, and a configurable higher-voltage DC bus. It exposes the inverse current relationship, I²R cable-loss scaling, series/parallel battery-module geometry, charge current, bus-current basis, protection planning target, and first conductor meeting the entered voltage-drop/current-density screens.

The Equipment + Project BOM module turns the synchronized engineering outputs into datasheet-selection filters for battery modules, inverter, MPPT controller, PV modules, busbar, main disconnect, and main protective device. User-entered manufacturer/model ratings are screened against the calculated requirements, then combined with branch conductors/protection/disconnects into an exportable CSV/JSON project BOM. Product data is intentionally user-entered rather than embedded as a live vendor catalog.

Engineering Handoff transfers bounded, typed operating points to compatible Neutron STEM Lab workbenches. The inverter branch can populate DC wire sizing, the inverter power-stage operating point can populate the MOSFET loss/thermal tool, and battery/SOC/current-limit context can accompany a control-system model without inferring missing plant dynamics.

Engineering Project Report consolidates the synchronized sizing, storage, inverter, PV string, distribution, equipment, seasonal reliability, lifecycle, and BOM results into a browser-local planning record. It separates modeled pass/review/fail screens from mandatory external engineering review so the export cannot be mistaken for a stamped design or code-compliance certificate.

The DC wiring module estimates voltage drop, conductor loss, and a configurable current-density screen. It deliberately does not label the result as code-compliant ampacity.

Engineering theory

Energy and power solve different design problems

Battery capacity and daily generation are energy problems measured in watt-hours or kilowatt-hours. Inverter rating, branch current, and starting surge are power problems measured in watts, volt-amperes, or amperes. A system can have enough stored energy for a full day but still fail instantly if its inverter, BMS, conductors, or source cannot supply a short high-power event.

The workbench therefore derives a daily energy budget and an instantaneous AC running/surge budget separately from the same load list.

Bus voltage sets current stress for the same power

For a fixed power level, DC current is approximately inversely proportional to bus voltage. A 48 V-class architecture therefore carries roughly one quarter of the current of a 12 V-class architecture at the same inverter power, before accounting for small differences in actual module voltage and efficiency.

Because conductor loss is I²R, the loss reduction on the same conductor can be much larger than the current reduction. The trade is that higher DC voltage demands appropriately rated equipment, protection, insulation, disconnects, enclosures, and safety practices; lower current alone is not a complete architecture decision.

DC distribution must separate continuous current, voltage drop, and protection coordination

A conductor can meet a voltage-drop target and still be unsuitable for an installation because ampacity, insulation temperature, termination limits, bundling, environment, and fault protection are separate constraints. Likewise, a fuse or breaker nominal current cannot be selected safely from load current alone without its DC voltage rating, interrupt rating, and time-current behavior.

The Distribution + Protection module therefore exposes three different screens: a continuous-current planning basis, a voltage-drop/current-density conductor screen, and entered manufacturer ratings for busbars and disconnects. It intentionally does not convert those screens into a code-compliance approval.

Battery capacity changes with age, temperature, and discharge rate

Nameplate amp-hours describe a rated test condition, not a fixed amount of usable energy under every operating condition. Capacity retention with age, low-temperature capacity loss, current-dependent rate effects, BMS limits, and usable depth of discharge all change the practical energy available to a system.

Battery Realism keeps those planning factors visible. Peukert behavior is especially useful for lead-acid screening; lithium systems usually have a smaller rate-capacity effect but can still be constrained by BMS current and charge-temperature limits.

Hybrid systems need source priority and hysteresis

Adding a generator or shore/grid source changes the problem from static sizing to dispatch. A controller must decide when external power supports loads, when the battery should discharge, when charging should begin, and when a generator should stop.

The hybrid model uses explicit source priority, SOC thresholds, charge targets, source power limits, and generator minimum run time so the behavior can be inspected instead of hidden behind an automatic mode.

Solar sizing is an energy-replacement calculation before it is a string-design calculation

At the planning level, required array wattage is daily energy divided by effective full-sun hours, array derating, and charging efficiency. This estimates how much rated PV power is needed to replace the expected daily load energy.

Electrical string design is a separate step because module open-circuit voltage changes with temperature and controllers have strict input-voltage and current limits. Phase 4 intentionally keeps that boundary visible.

Lifecycle adequacy is repeated reliability under changing capacity and output

A design that serves every load in year one can become marginal later as battery usable capacity falls, PV output degrades, loads grow, or generator service accumulates. Lifecycle analysis therefore has to feed changing assumptions back through the same time-series dispatch rather than multiply a first-year cost by the project duration.

The lifecycle module intentionally exposes cycle-life, calendar-fade, PV-degradation, load-growth, energy-cost, maintenance, and replacement assumptions. They are scenario variables for sensitivity analysis, not manufacturer warranty claims.

Seasonal adequacy is a time-series reliability problem

A system that balances energy on an average day can still fail during a low-solar month or a sequence of high-demand days. Long-duration adequacy therefore depends on the chronology of load, PV generation, storage state of charge, source limits, and backup-source control rather than annual energy totals alone.

Phase 4.10 reuses the existing hourly hybrid dispatcher across 7, 30, or 365 days and aggregates the results by calendar month. Loss-of-load hours, longest consecutive deficit, minimum SOC, generator runtime, grid energy, PV curtailment, and battery throughput make weak periods visible.

Optimization is a constrained engineering search, not a magic answer

A power-system optimizer is only meaningful when every candidate is evaluated against the same load, resource, efficiency, battery, cable, and source-dispatch assumptions. Phase 4.9 therefore treats optimization as a bounded scenario sweep: it enumerates explicit candidate values for bus voltage, battery energy, PV power, inverter rating, controller current, and generator start SOC, then runs the same hybrid dispatch and cable-loss models for each case.

Feasibility is separated from ranking. A scenario must first satisfy the entered service, SOC, autonomy, renewable-contribution, generator-runtime, cable-loss, capital-cost, and bus-voltage constraints. Only then is it ranked by the selected objective. This prevents a cheap but unreliable design from winning simply because its cost is low.

A useful engineering report separates calculation results from approval

A calculation record should preserve the design basis, major sizing outputs, time-series reliability results, equipment assumptions, unresolved warnings, and the decisions that led to the current architecture. That makes the design reproducible and reviewable instead of leaving critical assumptions scattered across separate calculator screens.

Phase 4.12 therefore exports both modeled screening checks and a separate list of mandatory external engineering review items. A modeled pass means only that the entered values satisfy the equations and screens implemented by this workbench; it is not a code-compliance certificate, manufacturer approval, professional engineering stamp, or construction authorization.

Low-voltage DC systems can carry very high current

For the same power, current rises as system voltage falls. A 3 kW load at 12 V requires roughly four times the current of the same load at 48 V before losses are included. This drives conductor size, voltage drop, connector stress, protective-device selection, and BMS/inverter input requirements.

The integrated inverter and DC wiring modules are therefore linked through the battery-bank voltage rather than treated as unrelated calculators.

Inputs and outputs explained

Inputs

Load powerW

Rated or representative running power for each AC or DC load.

Operating time, start hour, and duty cycleh/day, hour, and 0–1

Defines each load's daily scheduling window and the average energized fraction inside that window.

Surge multiplier×

First-pass AC starting/inrush multiplier used for inverter surge screening.

Use manufacturer surge or startup measurements when available.
Battery bank voltageV

Nominal DC bus voltage used for amp-hour conversion and DC-side current estimates.

Usable depth of discharge0–1

Fraction of nominal battery energy permitted for the planning calculation.

Peak sun hoursh/day

Equivalent full-power solar hours used for first-pass energy harvesting.

Array derate and charge efficiency%

Planning factors for PV and charging losses.

Dispatch limitsW, A, %

Installed inverter rating, controller current, battery/BMS charge/discharge current, initial SOC, and simulation duration.

Measured profile CSVtimestamp + W or W/m²

Optional timestamped load, PV-power, or irradiance data. ISO timestamps are preferred; relative numeric hours are also accepted.

Battery realism factors%, k, C, °C

Retained capacity, temperature capacity factor, Peukert exponent/reference rate, charge/discharge C-rate limits, and charge-temperature threshold.

Grid / shore sourceW, h, %, % efficiency

Optional source power, daily availability window, backup SOC threshold, charge target/power, and charger efficiency.

Generator sourceW, %, h, L/h

Optional rated power, auto-start/stop SOC, minimum run time, charge target/power, charger efficiency, and no-load/full-load fuel rates.

PV module/controller datasheet limitsV, A, %/°C

Voc, Vmp, Isc, temperature coefficients, MPPT window, and controller absolute/output limits for string design.

Optimization candidate listsV, ×, %, A

Bounded comma-separated candidates for DC bus voltage, battery-energy multiplier, PV-power multiplier, inverter/controller sizing multipliers, and generator-start SOC.

Optimization constraints%, days, h, $, V

Minimum demand served, minimum SOC/autonomy/PV contribution, maximum generator runtime, inverter-cable loss, entered capital cost, and preferred maximum bank voltage.

Seasonal simulation windowdays, month, ×

7, 30, or 365-day duration, starting month, and twelve Jan-Dec load/PV multipliers used to shape long-term synthetic scenarios.

DC cable runV, A, m, AWG

Voltage, current, one-way length, conductor material, gauge, and temperature for voltage-drop/loss estimation.

Report metadata

Project revision, preparer, location, design objective, decision notes, and optional report-section controls stored with the browser-local project state.

Outputs

Daily load energyWh/day

Total energy demanded by the configured loads.

Battery targetWh and Ah

Nominal storage required for the selected autonomy, reserve, DoD, and efficiency.

Battery module geometry

Approximate series and parallel module counts for the entered module voltage/capacity.

Inverter continuous and surge targetsW

Planning ratings derived from AC running and surge load totals.

Solar array targetW

Minimum and margin-adjusted array rating from daily energy and solar-resource assumptions.

Charge-controller current targetA

Approximate controller output current at the selected battery voltage.

Hourly dispatchW, Wh, % SOC

Load/PV power, battery state of charge, unserved energy, curtailed PV, and service percentage over 1–30 repeated days.

Effective battery capacityAh, Wh, h, C

Aged/temperature/rate-adjusted capacity, usable energy, representative runtime, and C-rate/current screens.

Hybrid source dispatchW, Wh, % SOC, L

Grid/shore and generator energy, generator starts/run time/fuel estimate, source-mode changes, battery SOC, and unserved demand.

Seasonal reliability summarykWh, %, h, L, equivalent cycles

7/30/365-day service percentage, monthly energy balance, minimum/final SOC, grid/generator use, fuel estimate, PV contribution/curtailment, loss-of-load hours, longest deficit streak, and battery throughput.

PV string layout

Candidate and recommended series × parallel layouts checked against temperature-adjusted voltage and controller current limits.

Equipment requirement screen

Pass/review/fail checks comparing user-entered battery, inverter, controller, panel, busbar, disconnect, and main-protection ratings against synchronized design requirements.

Project BOM

Exportable CSV/JSON bill of materials containing major equipment plus synchronized branch conductors, branch protection, disconnects, optional generator, status, notes, quantities, and user-entered costs.

Engineering project report

Printable/save-to-PDF HTML plus portable JSON containing the current design basis, load/storage/generation summary, PV string, distribution, seasonal reliability, optional lifecycle and BOM sections, modeled screen status, required review items, and project decision notes.

Ranked optimization scenarios

Feasible-first scenario table containing architecture, battery/PV/inverter/controller sizing, service percentage, minimum SOC, renewable contribution screen, generator use, cable loss, entered cost estimate, and failed constraints.

Runtimeh

Constant-load runtime from nominal battery energy, DoD, and path efficiency.

DC voltage drop and cable lossV, %, W

Two-conductor loop performance estimate for the selected cable.

Calculators and topics covered

  • off grid power
  • battery bank
  • solar sizing
  • inverter sizing
  • power system design
  • runtime
  • DC wiring
  • charge controller
  • energy dispatch
  • PV string sizing
  • MPPT
  • battery aging
  • Peukert
  • generator dispatch

Core equations

E_daily = Σ(P_load · quantity · hours/day · duty cycle)E_battery,nominal = E_daily · autonomy · (1 + reserve) / (DoD · η_discharge)C_bank,Ah = E_battery,nominal / V_bankP_inverter,continuous = P_AC,running · (1 + margin)I_DC,inverter ≈ P_AC / (V_bank · η_inverter)P_PV,min = E_daily / (PSH · derate · η_charge)I_controller ≈ P_array · η_controller / V_bankSOC[k+1] = SOC[k] + E_charge[k]/E_nominal − E_discharge[k]/E_nominalC_effective ≈ C_rated · f_age · f_temperature · min[1,(I_ref/I_load)^(k_Peukert−1)]I_max ≈ C_Ah · C-rate_limitI_branch,design = I_continuous · continuous-current factorI_bus,basis = max(ΣI_load, ΣI_charge) · bus continuous-current factorFor equal power: I_DC ≈ P/(V_bus · η), so doubling bus voltage approximately halves currentFor a fixed conductor path: P_cable = I²R, so halving current reduces cable loss to roughly one quarterV_oc,cold = N_s · V_oc,STC · [1 + α_Voc(T_min − 25°C)]V_mp,hot = N_s · V_mp,STC · [1 + α_Vmp(T_cell,max − 25°C)]t_runtime = V_bank · Ah · DoD · η / P_loadΔV_DC = 2 I L R_conductor

Worked examples

Small 48 V off-grid power system

A small system runs a refrigerator, laptop, LED lighting, and a short-duration pump load. Size first-pass storage, inverter, and PV using the default Phase 4 example.

Inputs
  • 48 V target battery bank
  • LiFePO₄ planning preset
  • 1.5 days autonomy
  • 15% energy reserve
  • 5 peak-sun-hours/day
  • 400 W PV modules
Method
  1. Build the daily load budget from operating hours and duty cycles.
  2. Convert the energy target into nominal battery capacity using DoD and efficiency.
  3. Use AC running/surge totals for the inverter target.
  4. Divide daily energy by effective solar hours and round the result up to whole panels.

Result: The tool returns synchronized battery, inverter, PV, controller-current, runtime, and distribution targets from the same load assumptions.

Interpretation: The result is a design starting point. Product datasheets, environmental conditions, fault protection, code requirements, and installation details remain separate checks.

Common mistakes

Sizing everything from watt-hours

Energy capacity alone does not prove an inverter, BMS, conductor, or battery can supply peak current.

Better approach: Check continuous power, surge power, DC current, BMS discharge limits, cable loss, and protective devices separately.

Using 100% battery capacity as usable energy

Nameplate watt-hours are not the same as reliably delivered energy.

Better approach: Apply a realistic usable depth of discharge, path efficiency, reserve, temperature limits, and manufacturer guidance.

Treating peak sun hours as daylight hours

Six hours of daylight does not mean six hours at rated panel power.

Better approach: Use site-appropriate equivalent peak-sun-hours or, for detailed design, an hourly solar-resource model.

Selecting a controller from output current only

A controller can satisfy battery-side current and still be damaged by excessive PV open-circuit voltage.

Better approach: Verify PV Voc at cold temperature, Vmp range, input current, string configuration, and all controller limits before wiring.

Ignoring battery capacity fade and cold-weather derating

A bank sized only from new-nameplate capacity can miss autonomy or current targets as it ages or cools.

Better approach: Apply measured/manufacturer capacity retention and temperature factors, then check BMS current and charging-temperature limits separately.

Treating generator/grid dispatch as transfer-switch design

An energy simulation does not prove that AC sources can be safely interconnected or transferred.

Better approach: Use the hybrid module for source-energy planning only; verify listed transfer equipment, neutral/ground behavior, anti-islanding, grounding, protection, and manufacturer instructions independently.

Picking a fuse from load current alone

A nominal fuse/breaker current does not prove that the device can interrupt the available DC fault current or tolerate inverter/motor inrush.

Better approach: Use the workbench protection value only as a planning target. Verify conductor ampacity, DC voltage rating, interrupt rating, equipment instructions, and the actual fuse/breaker time-current curve.

Using busbar current rating as a fault-current rating

A manufacturer continuous-current rating says nothing about short-circuit withstand or protective-device coordination.

Better approach: Verify the busbar manufacturer short-circuit/withstand data, enclosure/terminal limits, available fault current, and upstream protection separately.

Assuming the highest DC voltage is automatically best

Higher voltage reduces current and cable loss but also changes battery-series count, equipment voltage ratings, DC arc/fault behavior, isolation, disconnects, and shock/touch-risk controls.

Better approach: Use Architecture Comparison to quantify the current/loss benefit, then choose voltage using actual equipment, protection, environment, serviceability, and applicable standards.

Treating a datasheet screen as equipment approval

A candidate can satisfy nominal voltage/current/power checks while still failing surge duration, interrupt rating, thermal, terminal, environmental, certification, or manufacturer application requirements.

Better approach: Use Equipment + Project BOM to narrow candidates, then verify the current manufacturer datasheet and all installation-specific requirements before purchase or construction.

Trusting imported logger data without checking its basis

A clean CSV can still contain wrong CT/PT scaling, missing intervals, mixed time zones, AC-side power mislabeled as DC-bus power, or irradiance from a poorly placed sensor.

Better approach: Review the source instrument, units, time zone, gaps, and measurement location before using measured profiles for design decisions.

Treating monthly multipliers as a weather forecast

A smooth seasonal factor can hide multi-day cloud events, snow cover, heat-related PV derating, unusual occupancy, or outages that dominate real reliability.

Better approach: Use the seasonal module for scenario screening, then validate critical designs with measured multi-month profiles or site-specific resource data and deliberate worst-case scenarios.

Optimizing bad assumptions more efficiently

A mathematically ranked design can look precise even when the load schedule, solar resource, fuel rate, battery limits, or equipment costs are poor assumptions.

Better approach: Validate the input profiles and equipment data first, then treat the optimizer as a bounded comparison tool. Re-run detailed PV string, distribution/protection, equipment, and safety checks after applying a candidate.

Treating the generated report as an approved design

A polished report can look authoritative even though many installation-critical requirements depend on site conditions, product ratings, fault current, adopted codes, and professional review.

Better approach: Use the report as a traceable engineering planning record. Resolve every modeled failure/review item and complete the report's external engineering review checklist before construction.

Calling current density ampacity

A simple A/mm² screen does not implement installation-specific conductor rules.

Better approach: Use the wiring result for voltage-drop/loss screening and verify code/manufacturer ampacity and protection independently.

Method and assumptions

The workbench first converts every load into running power, average active power, and daily watt-hours. That shared load summary is then passed into independent battery, inverter, and solar sizing functions so one edit propagates through the complete design.

Battery sizing divides the required delivered energy by usable depth of discharge and discharge efficiency, then maps the resulting nominal energy to a simple series/parallel module model. The actual module-derived bank voltage is shown so a mismatch with the target voltage is visible.

PV sizing first computes the array needed to replace daily energy under the entered peak-sun-hours and derating assumptions, adds a user-controlled design margin, rounds up to whole panels, and estimates charge-controller output current.

Hourly dispatch converts each load schedule into 24 one-hour bins, converts AC demand to DC-bus demand through inverter efficiency, distributes the daily PV energy across the selected solar window, and then applies direct PV supply, battery charge/discharge limits, usable-SOC floor, charge/discharge efficiency, inverter rating, unserved-demand accounting, and PV curtailment.

Battery Realism begins with the installed amp-hour capacity, applies explicit aging and temperature capacity multipliers, then applies a conservative Peukert/rate-capacity factor based on the entered exponent and reference discharge rate. It separately converts entered C-rate limits into maximum continuous charge/discharge current screens.

Hybrid dispatch reuses the same hourly load/PV/battery state. Grid/shore support can be preferred or held as a backup below an SOC threshold. Generator operation uses start/stop SOC hysteresis plus minimum run time, source/charger power limits, battery charge/discharge current limits, and a linear no-load-to-full-load fuel-rate estimate.

Long-term seasonal simulation constructs a calendar-aligned hourly series from the same daily load/PV bases, applies Jan-Dec multipliers to synthetic values, runs the unchanged hybrid dispatch logic for up to 365 days, then aggregates load, utilized PV, grid/generator energy, generator fuel/runtime, minimum SOC, battery throughput, curtailed energy, and loss-of-load metrics by month.

PV string design evaluates series/parallel candidates using first-order Voc/Vmp temperature coefficients. A candidate passes only if cold Voc is below the controller absolute maximum, hot/cold Vmp remain within the MPPT window, 1.25 × parallel Isc remains within the entered PV input-current limit, and estimated controller output current remains within its rating.

DC cable sizing derives AWG conductor area from the geometric gauge relationship, applies copper or aluminum resistivity with a first-order temperature correction, then calculates full-loop voltage drop and I²R loss.

DC distribution derives four synchronized branch-current models from the rest of the workbench: battery-to-inverter, PV-controller-to-bus, aggregate DC loads, and the larger enabled AC charging path. Each branch applies a user-selected continuous-current factor, cable drop/current-density screens, a rounded nominal protection planning target, and entered disconnect rating. The busbar screen uses the larger aggregate load-direction or charge-direction current multiplied by a separate bus continuous-current factor.

Architecture Comparison recomputes battery series/parallel geometry, inverter/DC-load current, PV charge current, bus current, fixed-conductor voltage drop/I²R loss, and an automatic conductor screen for each candidate voltage while keeping system power and energy assumptions unchanged. The highlighted candidate is only the lowest-current option within the user-entered preferred voltage ceiling that passes the modeled BMS-current and cable recommendation screens.

Equipment screening derives a compact set of minimum/range checks from the synchronized battery, inverter, PV-string, and distribution results. Battery module candidates are converted into a whole-module series/parallel bank; inverter and controller candidates are checked against voltage/current/power windows; PV changes are flagged for string revalidation; and busbar/disconnect/protection candidates are screened against DC voltage/current targets. The BOM preserves pass/review/fail status and user-entered cost without treating a candidate as certified.

Cross-workbench handoff uses a versioned neutron-engineering-handoff envelope containing source provenance, an explicit target tool and engineering intent, and a bounded typed payload. Destination tools validate the envelope and apply only fields they explicitly support; unsupported context remains informational.

Assumptions

  • Daily load energy uses user-entered operating hours and duty cycle. The hourly dispatch model treats duty cycle as average power within each load's scheduled operating window and uses one-hour time steps rather than minute-by-minute switching.
  • Battery nominal energy is reduced by user-selected usable depth of discharge and discharge-path efficiency. Chemistry presets are planning defaults, not battery-manufacturer limits.
  • Battery Realism applies user-entered retained-capacity and temperature multipliers and a conservative Peukert/rate-capacity screen. It does not infer hidden manufacturer curves.
  • Hybrid dispatch treats grid/shore and generator sources as bounded AC inputs feeding the same DC-bus-equivalent hourly model through user-entered charger efficiencies. It is an energy/power model rather than a transfer-switch electrical model.
  • Seasonal simulation uses a non-leap 365-day calendar and twelve user-entered monthly multipliers. Synthetic load/PV profiles are scaled by the active calendar month; imported measurements are preserved unless the user explicitly enables scenario scaling of measured data.
  • Lifecycle projection standardizes each modeled project year to a 365-day dispatch. Battery capacity fade is derived from equivalent full cycles plus a user-entered calendar-fade scenario; replacement resets battery age/cycle counters for the following year. Generator maintenance and replacement are run-hour threshold events.
  • PV energy uses peak-sun-hours with a single derate factor when synthetic solar mode is selected. Measured Profile Import can instead use measured PV power or measured irradiance; irradiance conversion still uses the installed array rating and an explicit user-entered derate rather than a full module-temperature/weather model.
  • Imported power samples are treated as piecewise-constant until the next timestamp and are energy-preserving resampled into one-hour bins. The last sample uses the median source interval, and large gaps are flagged for review.
  • Inverter surge sizing conservatively sums configured AC starting surges; real equipment may have non-coincident or differently shaped inrush events.
  • DC cable calculations use bulk conductor resistivity and a complete source-to-load-to-source loop.
  • Architecture Comparison treats 12 V, 24 V, 48 V, and the configurable higher-voltage value as nominal bus classes. Actual bank voltage is derived from whole battery modules and may differ from the class label.
  • Engineering handoffs transfer only quantities explicitly represented by both source and destination. Device switching parameters, plant dynamics, PID gains, conductor ampacity, and protection coordination are not inferred from unrelated source values.
Limitations and design boundaries

  • This is not an electrical-code compliance, permitting, inspection, arc-flash, fault-current, protection-coordination, grounding/bonding, or product-certification tool.
  • PV String + MPPT checks are first-pass datasheet calculations. They do not replace manufacturer-specific temperature-correction procedures, series-fuse limits, conductor/protection design, rapid-shutdown/disconnect rules, grounding/bonding, or locally adopted requirements.
  • Battery Realism includes explicit age retention, temperature capacity factor, Peukert/rate screening, low-temperature charge warning, and C-rate limits, but it still does not model cell voltage curves, internal resistance, voltage sag, thermal rise, cell balancing, resistance growth, or manufacturer-specific SOC/BMS maps.
  • Hybrid source dispatch includes source-power limits, grid/shore availability, battery-first or grid-first priority, generator SOC hysteresis/minimum run time, and a linear fuel estimate. It does not design transfer switches, neutral/ground switching, anti-islanding, synchronization, generator grounding, power factor, or code-compliant interlocks.
  • The DC distribution module is a planning screen only: it does not calculate available fault current, interrupt ratings, selective coordination, conductor ampacity, terminal temperature limits, fuse/breaker time-current behavior, battery short-circuit current, or jurisdiction-specific OCPD rules.
  • Architecture Comparison does not decide that the highest voltage is safest, cheapest, or best. It does not model insulation coordination, touch/shock protection, creepage/clearance, contactor precharge, DC arc behavior, component availability, or jurisdiction/product-specific voltage thresholds.
  • Equipment screening only compares the user-entered datasheet values to requirements modeled by this workbench. It does not verify authenticity, revision, certification/listing, warranty, environmental suitability, terminal ratings, surge duration, fault interrupt capability, or manufacturer application rules.
  • The seasonal model does not forecast weather, snow cover, module temperature, stochastic outages, or extreme events. The lifecycle module adds transparent scenario degradation and replacement assumptions, but it is not a chemistry-specific battery aging model, PV warranty predictor, stochastic failure model, or discounted financial analysis.

Validation cases

These checks document how representative calculations are cross-checked against analytic or reference results.

Validation policy

Daily energy summation

Verified result
Method
120 W load × 24 h/day × 35% duty plus 30 W × 5 h/day.
Expected
1158 Wh/day.
Observed
1158 Wh/day in the engine regression test.
Tolerance
Floating-point arithmetic only.

Constant-load runtime identity

Verified result
Method
24 V × 200 Ah × 0.8 usable DoD × 0.9 efficiency divided by 500 W.
Expected
6.912 h.
Observed
6.912 h in the engine regression test.
Tolerance
Floating-point arithmetic only.

DC loop resistance convention

Analytic cross-check
Method
Compare the cable calculation against 2IR using one-way conductor resistance.
Expected
Voltage drop uses the complete outbound and return path.

Hourly schedule energy conservation

Verified result
Method
Schedule a 100 W DC load for four hours starting at 22:00 so it wraps through midnight.
Expected
The 24 hourly bins sum to 400 Wh and populate 22:00, 23:00, 00:00, and 01:00.
Observed
400 Wh in the engine regression test.

PV string temperature check

Verified result
Method
Evaluate four 400 W modules with 49.8 V Voc, −0.28%/°C Voc coefficient, −10°C minimum temperature, and a 250 V controller.
Expected
A valid candidate keeps cold string Voc below 250 V while satisfying the entered MPPT/current limits.
Observed
The regression case returns a valid 4S × 1P candidate.

Battery derating identity

Verified result
Method
Apply 90% aging retention and 80% temperature capacity to a 200 Ah battery with Peukert exponent 1.0.
Expected
Effective capacity before DoD/path losses is 144 Ah.
Observed
144 Ah in the engine regression test.

DC distribution current basis

Verified result
Method
Evaluate 100 A and 20 A load branches plus a 60 A charge branch with a 1.25 bus continuous-current factor.
Expected
The load-direction aggregate is 120 A and the required bus continuous-current basis is 150 A.
Observed
150 A in the engine regression test.

DC architecture current/loss scaling

Verified result
Method
Compare 12 V-class and 48 V-class cases at the same 2.4 kW inverter power using the same cable resistance.
Expected
The 48 V-class inverter current is one quarter of the 12 V-class value and fixed-cable I²R loss is one sixteenth, subject to actual module-voltage rounding.
Observed
The engine regression test verifies the 4× current and 16× fixed-conductor loss ratios.

Equipment candidate and BOM consistency

Verified result
Method
Evaluate a 51.2 V, 10 kWh design against compatible battery, inverter, controller, PV, busbar, disconnect, and protection candidates, then build the BOM from those same evaluations.
Expected
All seven candidate groups pass the modeled checks; eight 12.8 V/100 Ah modules are required and user-entered major-equipment costs sum to $3530.
Observed
The Phase 4 verifier checks both the equipment statuses/topology and BOM subtotal.

Measured CSV hourly energy preservation

Verified result
Method
Import four 15-minute samples at 400 W AC plus 100 W DC across one hour and resample the timestamped series.
Expected
The first hourly bin remains 400 W AC and 100 W DC, preserving 500 Wh of measured load energy for that hour.
Observed
The engine regression test verifies the parsed hourly bin values and interval.

365-day seasonal calendar aggregation

Verified result
Method
Run a constant 100 W load from an always-available grid source over a January-start non-leap year with unity monthly multipliers.
Expected
8760 hourly dispatch points, 12 monthly summaries, 74.4 kWh January load, 67.2 kWh February load, 876 kWh grid energy, and 100% service.
Observed
The Phase 4.10 verifier checks the calendar bins, monthly energy totals, full-year grid energy, and zero loss-of-load hours.

Scenario optimizer feasibility ordering

Verified result
Method
Sweep two DC bus voltages and two battery/PV multipliers against a continuous load with explicit service, SOC, autonomy, renewable, generator-runtime, cable-loss, and voltage constraints.
Expected
All feasible scenarios sort ahead of rejected scenarios and the returned best scenario satisfies every configured constraint.
Observed
The Phase 4 verifier checks feasible-first ordering and constraint compliance on the best returned scenario.

Lifecycle replacement threshold

Verified result
Method
Project a battery with 100 equivalent-full-cycle reference life, 80% end-of-life threshold, zero calendar fade, and one full cycle per year-equivalent dispatch.
Expected
Capacity declines with accumulated cycles and a replacement is scheduled after the modeled threshold is crossed; replacement resets the following year to a fresh battery.
Observed
The Phase 4.11 lifecycle verifier checks the degradation/replacement sequence and cumulative-cost accounting.

Engineering report consolidation

Verified result
Method
Generate the Phase 4.12 report from the same synchronized system, PV string, distribution, equipment, seasonal, lifecycle, and BOM state used by the interactive modules.
Expected
The report schema carries modeled pass/review/fail counts separately from mandatory external engineering review items and supports printable HTML plus portable JSON export.
Observed
The Phase 4.12 verifier checks the report module, export schema, print/save-PDF path, review boundary text, and full repository syntax.

Grid-first hybrid dispatch

Verified result
Method
Supply a continuous 500 W DC load for 24 h from an always-available 1 kW grid source with unity modeled charger efficiency.
Expected
12 kWh grid energy, 100% service, and no battery discharge.
Observed
The engine regression test preserves the initial battery SOC and supplies 12 kWh from grid/shore.

Sources and references

Primary sources are preferred for ratings, standards, manufacturer data, and externally defined constants.

Source policy
  • Battery and BMS manufacturer datasheetsUse the actual cell/module voltage, temperature, current, charge, discharge, series/parallel, and protection limits for final design.
  • PV module, inverter, and charge-controller manufacturer datasheetsVerify voltage/current windows, surge definitions, thermal derating, conversion efficiency, and environmental ratings.
  • NREL PVWatts methodology and documentationReference context for solar-resource, rated-array, and system-loss concepts; detailed production estimates should use site-specific inputs.
  • Neutron STEM Lab calculation methodologyThe site methodology page documents first-principles calculations, validation, assumptions, and source hierarchy.

Related concepts