Thermochemistry Workbench
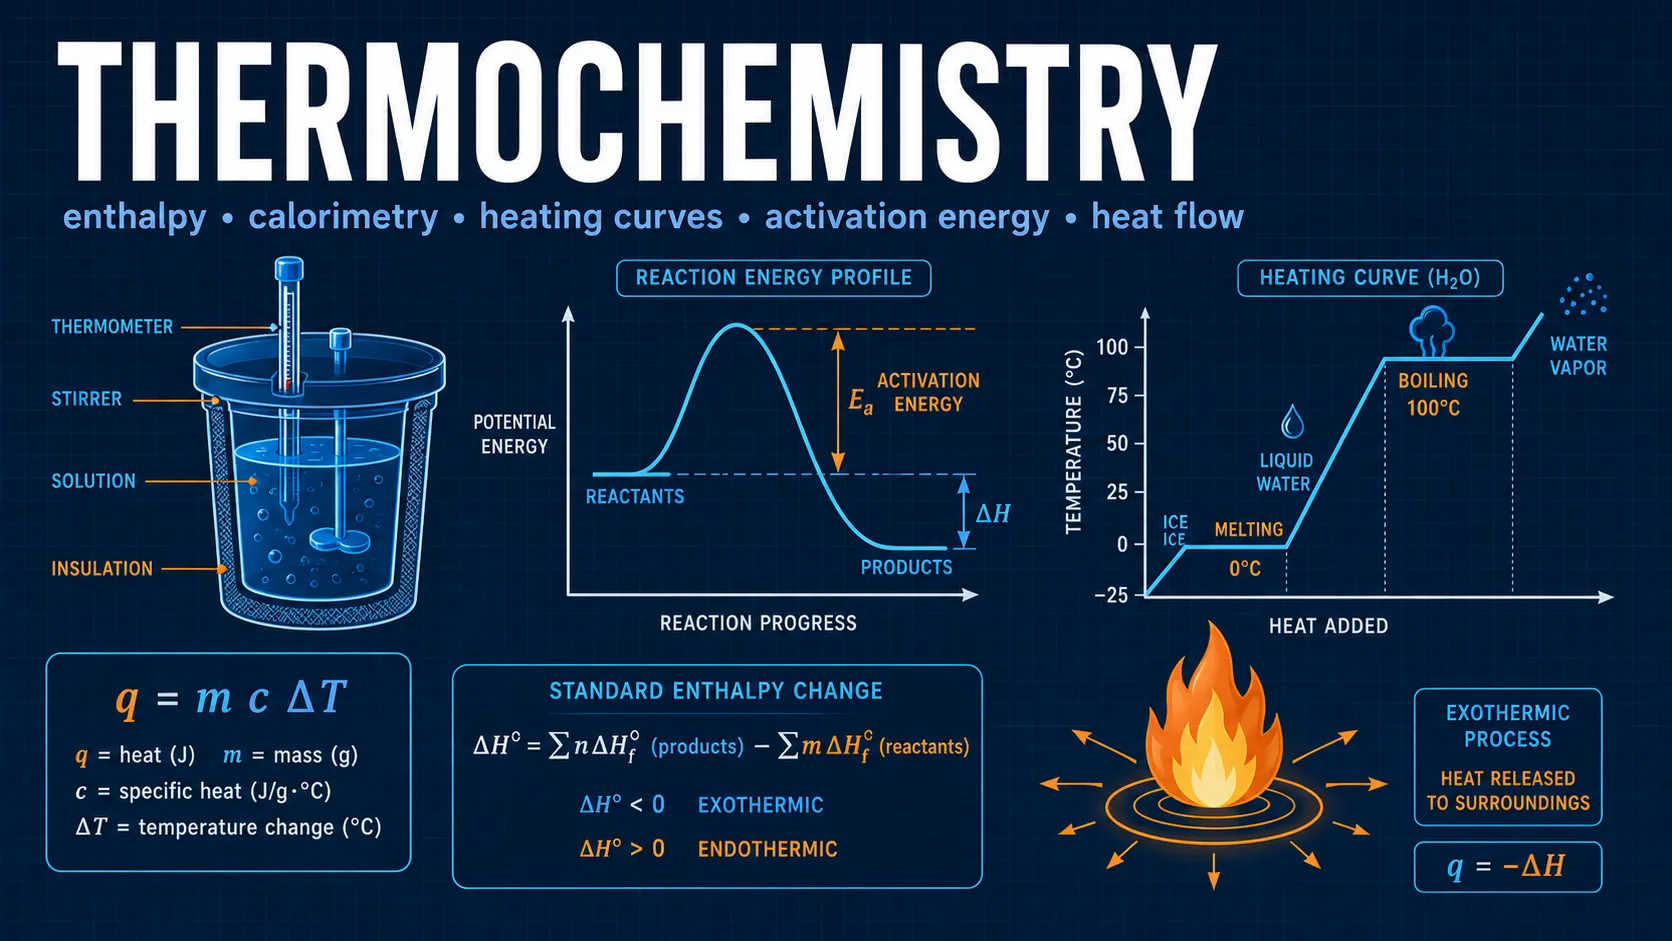
Guided thermochemistry lessons for calorimetry, formation enthalpy, Hess’s law, bond energies, heating curves, entropy, Gibbs energy, catalysts, fuels, and temperature corrections.
Engineering reference
Thermochemistry: theory, method, and sources
This chemistry workspace publishes 6 governing equations, 5 stated assumptions, 4 documented boundaries, and 3 sources so the numbers it returns can be checked rather than taken on trust.
How this tool works
Eleven guided modules connect experimental temperature changes and tabulated data to reaction energy, spontaneity, equilibrium, and kinetic barriers.
Every module states a chemical question, learning objective, observations, governing relationship, and practice challenge.
Diagrams use labeled units and explain what the current result means rather than displaying an isolated number.
Calculators and topics covered
- thermochemistry
- calorimetry
- enthalpy
- Hess law
- entropy
- Gibbs free energy
- heating curves
- bond enthalpy
- calorimetry calculator
- Hess law calculator
- formation enthalpy calculator
- bond enthalpy calculator
- heating curve calculator
- Gibbs free energy calculator
Core equations
Method and assumptions
Assumptions
- Coffee-cup calorimetry is treated as approximately constant pressure with negligible external heat loss.
- Bomb calorimetry reports constant-volume internal-energy change.
- Bond enthalpies are average gas-phase values and provide estimates.
- Gibbs and equilibrium calculations use the entered standard-state thermodynamic values.
- Kirchhoff correction assumes a constant reaction heat-capacity difference over the temperature interval.
Limitations and design boundaries
- The diagrams are conceptual and not molecular-dynamics simulations.
- Real calorimeters require calibration, heat-loss correction, and uncertainty analysis.
- Thermochemical data must use compatible reference states, units, and balanced stoichiometry.
- The tool is educational and does not replace laboratory safety procedures or validated process design.
Sources and references
Primary sources are preferred for ratings, standards, manufacturer data, and externally defined constants.
- Atkins and de Paula, Physical ChemistryEnthalpy, entropy, Gibbs energy, and Hess law treatment.
- NIST Chemistry WebBookStandard enthalpies of formation, entropies, and heat capacity data.
- Chase, NIST-JANAF Thermochemical TablesReference thermochemical data and standard state conventions.